|
Developing an ALGO Trading System by: Charles J. Tanti B.Sc.(Eng) |
|
To be a successful Trader, you have to be able to Trade without the Stress and Pressure of knowing what the market is doing on a Daily Basis. |
|
What is a trading system? A trading system is not the "Holy Grail". Most traders expect too much from a tradingsystem. If a system makes a few losing trades they usually give up just when the market is about to turn in their favor. A good trading system is nothing more than a tool to turn the odds in your favor by employing a proven consistent trading methodology. To be successful, a trader must overcome hope, fear and greed and learn to be patient. The market is always right. A trader needs to pay close attention to the market. He must be able to analyze and interpret the information in the charts correctly and objectively without any emotion. Risk is a part of trading, and it cannot be avoided or eliminated. The successful trader knows this and accepts risk as part of the business of trading. However, he also has the knowledge and confidence that risk can be controlled. To trade a system profitably, one must have the discipline to execute the signals generated. Discipline comes from confidence, and confidence comes from knowledge. Therefore, it is very important to understand how your system works. Confidence and discipline also comes from experience, and therefore a trader must have the patience to observe a trading system in real time to see for himself how and where signals are generated. Every trader knows that in trading TIMING CAN BE EVERYTHING. If you can time your trades perfectly, you will never have to worry about a drawdown. But, as everyone knows, it is not as simple as this. No matter how good you are at technical analysis, most of the time the market is confusing: Is it going: Up, Down, or Sideways. Most traders, especially day traders, look at the market too closely. If you look at the market on a day-to-day basis, you will lose sight of the big picture. In other words, you will get confused about the long-term trend.
We all know the saying:
There is also another saying: As a Trader, your only "FRIEND" is the "TREND" As long as you trade with the Major Trend, you should not be too concerned about timing. The "TREND" will always come to your rescue. As long as you stay with it, and as long as you trade in the direction of the major trend.
| ||||
The key components of a Profitable Trading System are:
1.Choosing the right market. A long-term trading system, if it is going to be profitable, needs a market that has a tendency to trend for long periods of time. The trend must be evident on daily and weekly charts. Examples are the T-Bonds and T-Notes markets, as well as Currencies. These markets are driven by interest rates, which in turn are driven by the state of the economy. These forces do not turn on a dime. They build momentum and move in the same direction for months or years at a time. 2.Choosing the right price data to Reduce Noise. The data you feed into the system is very important. Daily price data usually has a lot of noise, which in turn can produce a lot of false reversals that can generate false trading signals, which are very hard to filter. On the other hand, weekly data is smoother and makes the major trend more evident. Weekly data will have less noise in it and is much easier to analyse. 3.Choosing a Long-Term indicator to find the Major Trend. Indicators are a mathematical way to measure the state and stength of the market. I have been developing and creating indicators for my systems for the last 30 years. During this time, I have found out that simple works better. For this reason I prefer a long term stochastic. Stochastics work the same way as moving averages, with one big advantage. A stochastic will show the trend of the market and can also indicate when a market has become over bought or over sold.
This is better than taking the signal from sign changes in the stochastic alone, which usually lags the market and will miss up to $3000 or more from the market turning point. |
| Developing the ATS-ZB32 |
|
1: Start - Applying only the stochastic to weekly data. 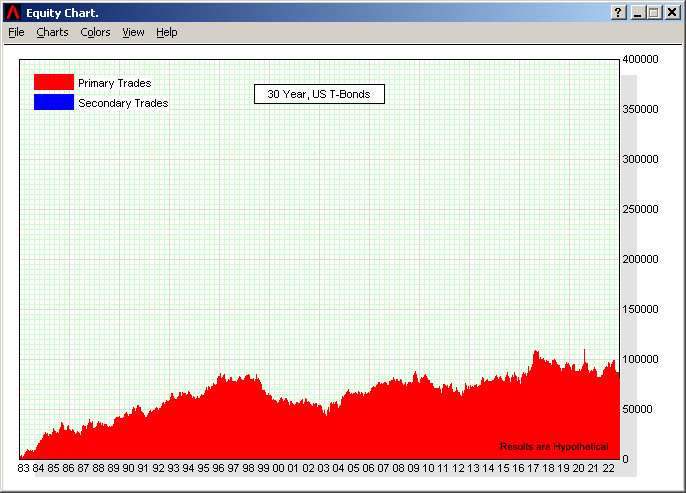
           Trade summary.
      Total No of trades: 260
    No of winning trades: 109
     No of losing trades: 151

           Average Trade: $362
          Average Profit: $4084
            Average Loss: $2323-
           Total Profits: $94,359
             Ave. Profit: $2395/year
|
|
2: Applying a stochastic with a simple filter. 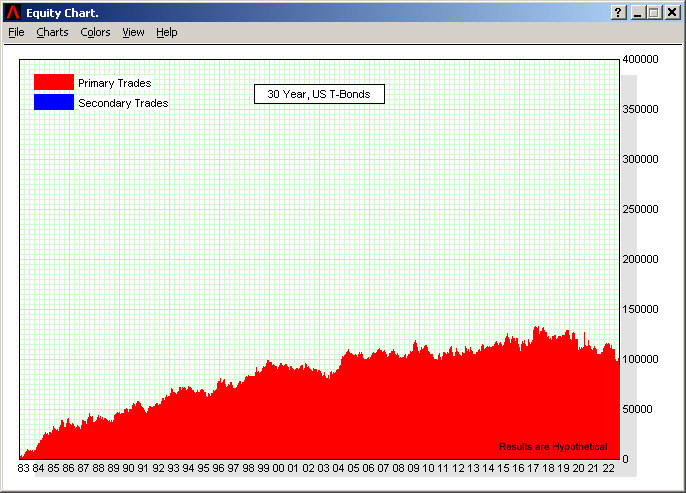
           Trade summary.
      Total No of trades: 212
    No of winning trades: 94
     No of losing trades: 118

           Average Trade: $443
          Average Profit: $4346
            Average Loss: $2682-
           Total Profits: $94,109
             Ave. Profit: $2389/year
|
|
The performance of a trading system can be vastly improved by applying filtering algorithms to the long term indicator. For example, the stochastic may go from from negative to positive while the system is in a short trade. In this case, this will be a signal that the trend has changed. However, the market may have moved lower. Therefore, even though there was a sign change in the stochastic from "-" to "+", the market actually moved lower. Filtering algorithms can be designed and incorporated into a trading system to improve its performance. | |
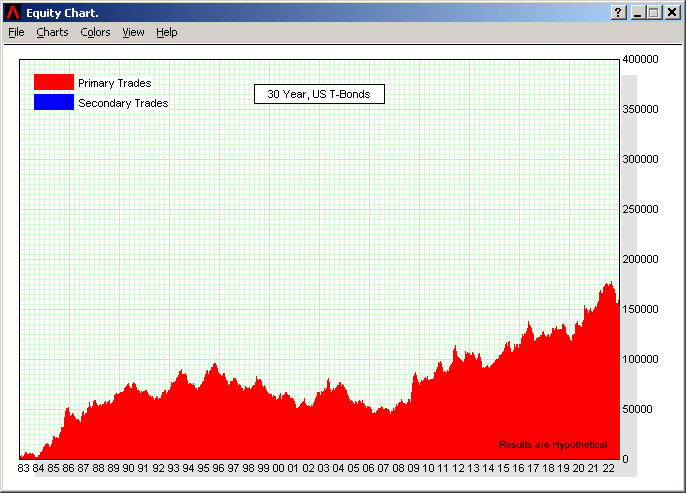
           Trade summary.
      Total No of trades: 82
    No of winning trades: 33
     No of losing trades: 49

           Average Trade: $1860
          Average Profit: $9786
            Average Loss: $3477-
           Total Profits: $152,562
             Ave. Profit: $3872/year
|
|
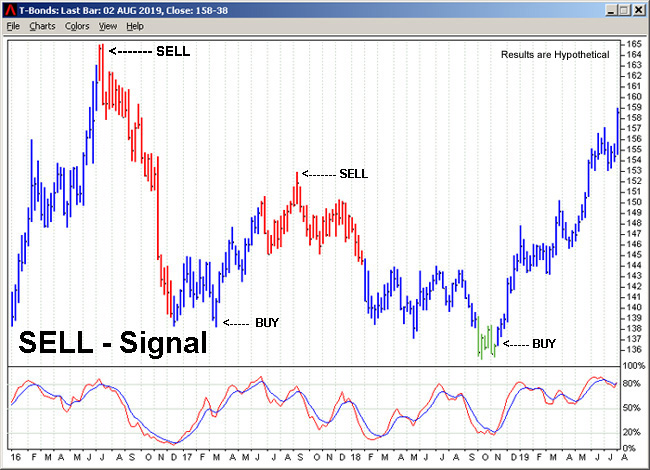
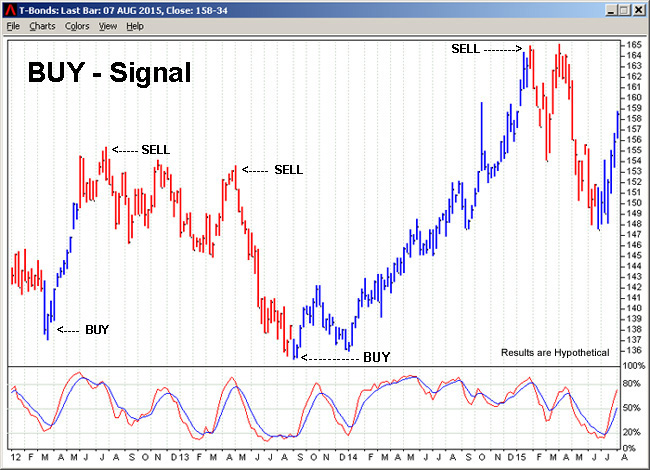
Incorporating Genetic Algorithms A long-term trading system usually gets the signal for the trend from either a moving average or a stochastic. These indicators always lag the market, and unless the market keeps the trend for very long periods of time and there is a substantial price difference between the top of the market and the bottom of the market, it is very difficult for a system to produce good profits. This is because a slow moving average or a long term stochastic normally misses up to $3000 from the top and up to $3000 from the bottom, i.e. $6000 in all. For a system to be truly profitable, it must be able to signal when a market is just going to turn around. Therefore, the system must be able to go short at or near the TOP, and be able to go long at or near the Bottom. This is made possible by creating algorithms that track several indicators at the same time to signal an extremely over bought or an extremely over sold market. Then taking the signal to go SHORT or LONG from several of these indicators at the same time. Since commodity markets cannot go up or down forever, they inevitably become over bought or over sold and turn around. A good algorithm will track a main indicator, but will only generate the buy or sell signal after a signal has been verified by several other built in indicators to produce more reliable and accurate results. Both the "ATS" systems have 15 of these genetic algorithms. These are called the "X" algorithms and the "L" algorithms. There are six "X" algorithms, these generate the "SELL" signals, and there are nine "L" algorithms, these generate the "BUY" signals. |
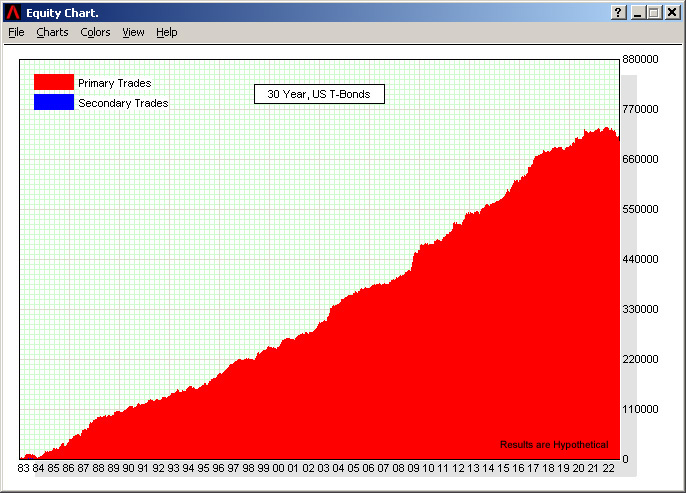
        Trade summary:
      Total No of trades: 93
    No of winning trades: 75
     No of losing trades: 18

           Average Trade: $7528
          Average Profit: $10281
            Average Loss: $3939-
           Total Profits: $700,171
             Ave. Profit: $17,771/year
|
|
The Function TREND makes the ATS-ZB32 almost Perfect |
|
The function TREND was designed to monitor the system while it is trading. If a trade startes to lose money, TREND checks the direction of the market. If the market is not moving in the direction of the trade, TREND takes the system out of the market with a small loss, preventing the system from getting in a deep loss, and thus reducing the drawdown. The ATS-ZB32 takes its signal to go SHORT or LONG from the stochastic. If the stochastice goes above 80% the system goes Short. If the stochastic goes below 20% it goes LONG. However the stochastic can go above 80% and the market can still keep going up. Similarly the stochastic can go below 20% and the market can stll keep going down. In each of these cases, the system will keep going SHORT or LONG, because the stochastic is over bought or over sold, and the trade will start to lose money, sometimes a lot of money. This is where TREND kicks in. If a trade starts to lose money, TREND checks the direction of the market. If the system is LONG, but the direction of the market is going lower and lower, and the trade is losing money, TREND gets the system out of the market, before the trade becomes a big loser. The same applies if the system is SHORT, but the direction of the market is going higher and higher. These are the results from the TREND function.
                    TREND TRADES            |       TREND TRADES TOTALS
 # WEEK-OF   SYSTEM   EXIT  REVERSE  TOTAL  |   SYSTEM      EXIT   REVERSE
--------------------------------------------+-----------------------------
 1 23NOV84    7343    9281    1937   11218  |     7343      9281      1937
 2 07JUL89   12343   11343    1000-  10343  |    19686     20624       937
 3 01APR94    7812   12562    4750   17312  |    27498     33186      5687
 4 08JUL94    3125-     31    3156    3187  |    24373     33217      8843
 5 12JUN98    3218-   4562-   1343-   5906- |    21154     28654      7499
 6 19APR02    2531    2687     156    2843  |    23685     31341      7655
 7 15AUG03     718-  10187    9906   20093  |    22966     41528     17561
 8 05MAY06   11906   11687     218-  11468  |    34872     53215     17342
 9 05JUN09   24937   24640     296-  24343  |    59809     77855     17045
10 06AUG10   20203   17921    2281-  15640  |    80012     95776     14763
11 08OCT10    6156-   4468-   1687    2781- |    73855     91307     16450
12 16MAR12     937    4812    3875    8687  |    74792     96119     20325
13 06SEP13   18750   14250    4500-   9750  |    93542    110369     15825
14 08JUL16   35281   39468    4187   43656  |   128823    149837     20012
15 05OCT18    4906-   1687    6593    8281  |   123916    151524     26605
16 20MAR20   13125   18062    2000-  16062  |   137041    169586     24605
17 05JUN20     937-   4281    6125   10406  |   136103    173867     30730
18 08OCT21    4281-    562-   3718    3156  |   131821    173304     34448
19 25MAR22    6500-   2875-   6906    4031  |   125321    170429     41354
20 17JUN22   14468-   3906-   7500    3593  |   110852    166522     48854
21 28OCT22   12875-   6562   19437   26000  |    97977    173084     68291
22 17MAR23     343-   3531    3968    7500  |    97633    176615     72259
|
|
The TREND Function turned the Profit of $97,633 from the system |
|
Using functions to keep drawdowns to a minimum, reduce risk, and reduce the number of losing trades.
A good system must have functions to manage a trade after it is started.
|
 |
|
 |
About the Developer: Charles Tanti B.Sc.(Eng)
I cannot remember a time in my life when I really |

© Advanced Trading Systems Inc.